Crown Castle Reports Third Quarter 2020 Results, Updates Full Year 2020 Outlook, Provides Outlook for Full Year 2021 and Announces 11% Increase to Common Stock Dividend
|
||||||||||
| (in millions, except per share amounts) | Midpoint of Current Full Year 2021 Outlook(c) |
Midpoint of Current Full Year 2020 Outlook(c) |
Full Year 2019 Actual |
Full Year 2020 Outlook to Full Year 2021 Outlook % Change |
Full Year 2019 Actual to Full Year 2020 Outlook % Change |
| Site rental revenues | +4% | +4% | |||
| Net income (loss) | +22% | -5% | |||
| Net income (loss) per share—diluted(a) | +28% | —% | |||
| Adjusted EBITDA(b) | +5% | +4% | |||
| AFFO(a)(b) | +12% | +9% | |||
| AFFO per share(a)(b) | +10% | +7% |
(a) Attributable to CCIC common stockholders.
(b) See "Non-GAAP Financial Measures, Segment Measures and Other Calculations" for further information and reconciliation of this non-GAAP financial measure to net income (loss).
(c) As issued on
"We delivered solid results in the third quarter and remain on track to generate growth in AFFO per share for 2020 that is consistent with our long-term growth target of 7% to 8% per year," stated
"As we look ahead, we have increased our annualized common stock dividend by 11% to
We believe our ability to offer towers, small cells and fiber solutions, which are all integral components of communications networks and are shared among multiple tenants, provides us the best opportunity to generate significant growth while delivering high returns for our shareholders. Based on the expected growth in data traffic and wireless carrier network investment, we believe the
RESULTS FOR THE QUARTER
The table below sets forth select financial results for the quarter ended
| (in millions, except per share amounts) | Q3 2020 | Q3 2019 | Change | % Change |
| (As Restated)(c) | ||||
| Site rental revenues | +4% | |||
| Net income (loss) | - |
-33% | ||
| Net income (loss) per share—diluted(a) | - |
-25% | ||
| Adjusted EBITDA(b) | +4% | |||
| AFFO(a)(b) | +8% | |||
| AFFO per share(a)(b) | +6% |
(a) Attributable to CCIC common stockholders.
(b) See "Non-GAAP Financial Measures, Segment Measures and Other Calculations" for further information and reconciliation of this non-GAAP financial measure to net income (loss).
(c) See our Annual Report on Form 10-K for the year ended
HIGHLIGHTS FROM THE QUARTER
- Site rental revenues. Site rental revenues grew 4.0%, or
$52 million , from third quarter 2019 to third quarter 2020, inclusive of approximately$70 million in Organic Contribution to Site Rental Revenues and a$18 million decrease in straight-lined revenues. The$70 million in Organic Contribution to Site Rental Revenues represents approximately 5.5% growth, comprised of approximately 9.1% growth from new leasing activity and contracted tenant escalations, net of approximately 3.6% from tenant non-renewals. - Net income. Net income for the third quarter 2020 was
$163 million compared to$242 million during the third quarter of 2019 and was impacted by the retirement of$2.4 billion of senior unsecured notes duringJuly 2020 , which resulted in a$95 million loss on the retirement of long-term obligations. - Capital Expenditures. Capital expenditures during the quarter were
$377 million , comprised of$20 million of sustaining capital expenditures and$357 million of discretionary capital expenditures. Discretionary capital expenditures during the quarter primarily included approximately$274 million attributable to Fiber and approximately$73 million attributable to Towers. - Common stock dividend. During the quarter,
Crown Castle paid common stock dividends of approximately$518 million in the aggregate, or$1.20 per common share, an increase of approximately 7% on a per share basis compared to the same period a year ago. - Financing Activity. In July,
Crown Castle utilized net proceeds from aJune 2020 senior unsecured notes offering to retire an aggregate of$2.4 billion of senior unsecured notes. Also during the quarter, all outstanding shares ofCrown Castle's 6.875% Mandatory Convertible Preferred Stock were converted into approximately 14.5 million shares ofCrown Castle common stock. These conversions increased the diluted weighted average common shares outstanding for 2020 by approximately 6 million shares and reduced the annual preferred stock dividends paid by approximately$28 million when compared to full year 2019.
"We believe we can deliver on our long-term annual dividend growth target of 7% to 8% while at the same time making investments in our business that will support future growth," stated
OUTLOOK
This Outlook section contains forward-looking statements, and actual results may differ materially. Information regarding potential risks which could cause actual results to differ from the forward-looking statements herein is set forth below and in
The following table sets forth
| (in millions) | Full Year 2020 | Full Year 2021 | ||||
| Site rental revenues | to | to | ||||
| Site rental cost of operations(a) | to | to | ||||
| Net income (loss) | to | to | ||||
| Adjusted EBITDA(b) | to | to | ||||
| Interest expense and amortization of deferred financing costs(c) | to | to | ||||
| FFO(b)(d) | to | to | ||||
| AFFO(b)(d) | to | to | ||||
| AFFO per share(b)(d) | to | to | ||||
(a) Exclusive of depreciation, amortization and accretion.
(b) See "Non-GAAP Financial Measures, Segment Measures and Other Calculations" for further information and reconciliation of this non-GAAP financial measure to net income (loss).
(c) See reconciliation of "components of current outlook for interest expense and amortization of deferred financing costs" for a discussion of non-cash interest expense.
(d) Attributable to CCIC common stockholders.
Full Year 2020 and 2021 Outlook
The table below compares the current full year 2020 Outlook to both the prior full year 2020 Outlook issued on
| Midpoint of FY 2021 Outlook and FY 2020 Outlook Comparisons | ||||||
| (in millions, except per share amounts) | Current Full Year 2021 Outlook |
Current Full Year 2020 Outlook |
Change | % Change | Previous Full Year 2020 Outlook |
Current 2020 Compared to Previous 2020 Outlook |
| Site rental revenues | +4% | - |
||||
| Net income (loss) | +22% | - |
||||
| Net income (loss) per share—diluted(a) | +28% | - |
||||
| Adjusted EBITDA(b) | +5% | - |
||||
| AFFO(a)(b) | +12% | - |
||||
| AFFO per share(a)(b) | +10% | - |
||||
(a) Attributable to CCIC common stockholders.
(b) See "Non-GAAP Financial Measures, Segment Measures and Other Calculations" for further information and reconciliation of this non-GAAP financial measure to net income (loss).
- The reduction to the 2020 Outlook primarily reflects an expected shift in the timing of Towers activity from the second half of 2020 to the first half of 2021. The change in the timing of Towers activity negatively impacts the expected Organic Contribution to Site Rental Revenues by approximately
$20 million and services contribution from towers by approximately$50 million . In addition, straight-lined revenues from Towers for full year 2020 are expected to be approximately$20 million lower than previously expected, due to a combination of the timing of Towers activity as well as fewer lease extensions than previously forecasted. - These changes are offset by approximately
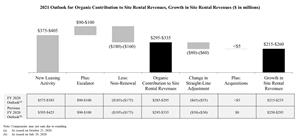
$10 million in lower expenses, approximately$30 million in lower interest expense and approximately$25 million in lower sustaining capital expenditures as compared to our prior 2020 Outlook. - The chart below reconciles the components of expected growth in site rental revenues from 2020 to 2021 of
$215 million to$260 million , inclusive of expected Organic Contribution to Site Rental Revenues during 2021 of$295 million to$335 million , or approximately 6%.
Chart 1: https://www.globenewswire.com/NewsRoom/AttachmentNg/a44e7d91-5f00-438d-adfb-18a47577b833 - New leasing activity is expected to contribute
$375 million to$405 million to 2021 Organic Contribution to Site Rental Revenues, consisting of new leasing activity from towers of$150 million to$160 million (compared to approximately$150 million expected in full year 2020), small cells of$65 million to$75 million (compared to approximately$70 million expected in full year 2020), and fiber solutions of$160 million to$170 million (compared to approximately$160 million expected in full year 2020). - In addition, discretionary capital expenditures are expected to be approximately
$1.5 billion in 2021, which compares to an expected$1.6 billion in 2020 and$1.9 billion in 2019. Prepaid rent additions are expected to be approximately$550 million in 2021, which compares to approximately$450 million expected in full year 2020 and approximately$650 million in 2019. - The expected decrease in discretionary capital expenditures of approximately
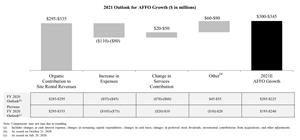
$400 million from 2019 to 2021 primarily reflects an expected decrease in small cell capital expenditures supporting similar revenue growth due to an expected increase in collocation activity, and the expected completion of several large fiber expansion projects by the end of 2020 that resulted from prior acquisitions. - The chart below reconciles the components of expected growth in AFFO from 2020 to 2021 of
$300 million to$345 million .
Chart 2: https://www.globenewswire.com/NewsRoom/AttachmentNg/90382e94-ad47-47ab-8292-81511796c74a - The expected contribution to 2021 AFFO growth of
$60 million to$90 million from Other items is primarily tied to the conversions of preferred stock that occurred during the third quarter, which will reduce annual preferred stock dividends paid by approximately$85 million when compared to full year 2020. - The increase in services contribution is a result of the expected increase in tower activity in 2021.
- The expected increase in expenses primarily reflects the combination of typical escalations and cost of living increases on the existing base of expenses, and incremental direct costs associated with Fiber revenue growth.
- Additional information is available in
Crown Castle's quarterly Supplemental Information Package posted in the Investors section of our website.
DIVIDEND INCREASE ANNOUNCEMENT
BOARD OF DIRECTORS APPOINTMENTS
In a separate press release today,
CONFERENCE CALL DETAILS
A telephonic replay of the conference call will be available from
ABOUT
Non-GAAP Financial Measures, Segment Measures and Other Calculations
This press release includes presentations of Adjusted EBITDA, Adjusted Funds from Operations ("AFFO"), including per share amounts, Funds from Operations ("FFO"), including per share amounts, and Organic Contribution to Site Rental Revenues, which are non-GAAP financial measures. These non-GAAP financial measures are not intended as alternative measures of operating results or cash flow from operations (as determined in accordance with Generally Accepted Accounting Principles ("GAAP")).
Our non-GAAP financial measures may not be comparable to similarly titled measures of other companies, including other companies in the communications infrastructure sector or other real estate investment trusts ("REITs"). Our definition of FFO is consistent with guidelines from the
In addition to the non-GAAP financial measures used herein, we also provide Segment Site Rental Gross Margin, Segment Services and Other Gross Margin and Segment Operating Profit, which are key measures used by management to evaluate our operating segments. These segment measures are provided pursuant to GAAP requirements related to segment reporting. In addition, we provide the components of certain GAAP measures, such as capital expenditures.
Our non-GAAP financial measures are presented as additional information because management believes these measures are useful indicators of the financial performance of our business. Among other things, management believes that:
- Adjusted EBITDA is useful to investors or other interested parties in evaluating our financial performance. Adjusted EBITDA is the primary measure used by management (1) to evaluate the economic productivity of our operations and (2) for purposes of making decisions about allocating resources to, and assessing the performance of, our operations. Management believes that Adjusted EBITDA helps investors or other interested parties meaningfully evaluate and compare the results of our operations (1) from period to period and (2) to our competitors, by removing the impact of our capital structure (primarily interest charges from our outstanding debt) and asset base (primarily depreciation, amortization and accretion) from our financial results. Management also believes Adjusted EBITDA is frequently used by investors or other interested parties in the evaluation of the communications infrastructure sector and other REITs to measure financial performance without regard to items such as depreciation, amortization and accretion which can vary depending upon accounting methods and the book value of assets. In addition, Adjusted EBITDA is similar to the measure of current financial performance generally used in our debt covenant calculations. Adjusted EBITDA should be considered only as a supplement to net income computed in accordance with GAAP as a measure of our performance.
- AFFO, including per share amounts, is useful to investors or other interested parties in evaluating our financial performance. Management believes that AFFO helps investors or other interested parties meaningfully evaluate our financial performance as it includes (1) the impact of our capital structure (primarily interest expense on our outstanding debt and dividends on our preferred stock (in periods where applicable)) and (2) sustaining capital expenditures, and excludes the impact of our (a) asset base (primarily depreciation, amortization and accretion) and (b) certain non-cash items, including straight-lined revenues and expenses related to fixed escalations and rent free periods. GAAP requires rental revenues and expenses related to leases that contain specified rental increases over the life of the lease to be recognized evenly over the life of the lease. In accordance with GAAP, if payment terms call for fixed escalations, or rent free periods, the revenue or expense is recognized on a straight-lined basis over the fixed, non-cancelable term of the contract. Management notes that
Crown Castle uses AFFO only as a performance measure. AFFO should be considered only as a supplement to net income computed in accordance with GAAP as a measure of our performance and should not be considered as an alternative to cash flows from operations or as residual cash flow available for discretionary investment. - FFO, including per share amounts, is useful to investors or other interested parties in evaluating our financial performance. Management believes that FFO may be used by investors or other interested parties as a basis to compare our financial performance with that of other REITs. FFO helps investors or other interested parties meaningfully evaluate financial performance by excluding the impact of our asset base (primarily depreciation, amortization and accretion). FFO is not a key performance indicator used by
Crown Castle . FFO should be considered only as a supplement to net income computed in accordance with GAAP as a measure of our performance and should not be considered as an alternative to cash flow from operations. - Organic Contribution to Site Rental Revenues is useful to investors or other interested parties in understanding the components of the year-over-year changes in our site rental revenues computed in accordance with GAAP. Management uses the Organic Contribution to Site Rental Revenues to assess year-over-year growth rates for our rental activities, to evaluate current performance, to capture trends in rental rates, new leasing activities and tenant non-renewals in our core business, as well to forecast future results. Organic Contribution to Site Rental Revenues is not meant as an alternative measure of revenue and should be considered only as a supplement in understanding and assessing the performance of our site rental revenues computed in accordance with GAAP.
We define our non-GAAP financial measures, segment measures and other calculations as follows:
Non-GAAP Financial Measures
Adjusted EBITDA. We define Adjusted EBITDA as net income (loss) plus restructuring charges (credits), asset write-down charges, acquisition and integration costs, depreciation, amortization and accretion, amortization of prepaid lease purchase price adjustments, interest expense and amortization of deferred financing costs, (gains) losses on retirement of long-term obligations, net (gain) loss on interest rate swaps, (gains) losses on foreign currency swaps, impairment of available-for-sale securities, interest income, other (income) expense, (benefit) provision for income taxes, cumulative effect of a change in accounting principle, (income) loss from discontinued operations and stock-based compensation expense.
Adjusted Funds from Operations. We define Adjusted Funds from Operations as FFO before straight-lined revenue, straight-lined expense, stock-based compensation expense, non-cash portion of tax provision, non-real estate related depreciation, amortization and accretion, amortization of non-cash interest expense, other (income) expense, (gains) losses on retirement of long-term obligations, net (gain) loss on interest rate swaps, (gains) losses on foreign currency swaps, acquisition and integration costs, and adjustments for noncontrolling interests, and less sustaining capital expenditures.
AFFO per share. We define AFFO per share as AFFO divided by diluted weighted-average common shares outstanding.
Funds from Operations. We define Funds from Operations as net income plus real estate related depreciation, amortization and accretion and asset write-down charges, less noncontrolling interest and cash paid for preferred stock dividends (in periods where applicable), and is a measure of funds from operations attributable to CCIC common stockholders.
FFO per share. We define FFO per share as FFO divided by the diluted weighted-average common shares outstanding.
Organic Contribution to Site Rental Revenues. We define the Organic Contribution to Site Rental Revenues as the sum of the change in GAAP site rental revenues related to (1) new leasing activity, including revenues from the construction of small cells and the impact of prepaid rent, (2) escalators and less (3) non-renewals of tenant contracts.
Segment Measures
Segment Site Rental Gross Margin. We define Segment Site Rental Gross Margin as segment site rental revenues less segment site rental cost of operations, excluding stock-based compensation expense and prepaid lease purchase price adjustments recorded in consolidated site rental cost of operations.
Segment Services and Other Gross Margin. We define Segment Services and Other Gross Margin as segment services and other revenues less segment services and other cost of operations, excluding stock-based compensation expense recorded in consolidated services and other cost of operations.
Segment Operating Profit. We define Segment Operating Profit as segment site rental gross margin plus segment services and other gross margin, less selling, general and administrative expenses attributable to the respective segment.
All of these measurements of profit or loss are exclusive of depreciation, amortization and accretion, which are shown separately. Additionally, certain costs are shared across segments and are reflected in our segment measures through allocations that management believes to be reasonable.
Other Calculations
Discretionary capital expenditures. We define discretionary capital expenditures as those capital expenditures made with respect to activities which we believe exhibit sufficient potential to enhance long-term stockholder value. They primarily consist of expansion or development of communications infrastructure (including capital expenditures related to (1) enhancing communications infrastructure in order to add new tenants for the first time or support subsequent tenant equipment augmentations or (2) modifying the structure of a communications infrastructure asset to accommodate additional tenants) and construction of new communications infrastructure. Discretionary capital expenditures also include purchases of land interests (which primarily relates to land assets under towers as we seek to manage our interests in the land beneath our towers), certain technology-related investments necessary to support and scale future customer demand for our communications infrastructure, and other capital projects.
Integration capital expenditures. We define integration capital expenditures as those capital expenditures made as a result of integrating acquired companies into our business.
Sustaining capital expenditures. We define sustaining capital expenditures as those capital expenditures not otherwise categorized as either discretionary or integration capital expenditures, such as (1) maintenance capital expenditures on our communications infrastructure assets that enable our tenants' ongoing quiet enjoyment of the communications infrastructure and (2) ordinary corporate capital expenditures.
The tables set forth on the following pages reconcile the non-GAAP financial measures used herein to comparable GAAP financial measures. The components in these tables may not sum to the total due to rounding.
Reconciliations of Non-GAAP Financial Measures, Segment Measures and Other Calculations to Comparable GAAP Financial Measures:
Reconciliation of Historical Adjusted EBITDA:
| For the Three Months Ended | For the Nine Months Ended | For the Twelve Months Ended |
|||||||||||||||||
2020 |
2019 |
2020 |
2019 |
2019 |
|||||||||||||||
| (in millions) | (As Restated)(d) | (As Restated)(d) | |||||||||||||||||
| Net income (loss) | $ | 163 | $ | 242 | $ | 548 | $ | 652 | $ | 860 | |||||||||
| Adjustments to increase (decrease) net income (loss): | |||||||||||||||||||
| Asset write-down charges | 3 | 2 | 10 | 13 | 19 | ||||||||||||||
| Acquisition and integration costs | 2 | 4 | 9 | 10 | 13 | ||||||||||||||
| Depreciation, amortization and accretion | 406 | 388 | 1,207 | 1,175 | 1,572 | ||||||||||||||
| Amortization of prepaid lease purchase price adjustments | 5 | 5 | 14 | 15 | 20 | ||||||||||||||
| Interest expense and amortization of deferred financing costs(a) | 168 | 173 | 521 | 510 | 683 | ||||||||||||||
| (Gains) losses on retirement of long-term obligations | 95 | — | 95 | 2 | 2 | ||||||||||||||
| Interest income | — | (2 | ) | (2 | ) | (5 | ) | (6 | ) | ||||||||||
| Other (income) expense | 3 | 5 | 3 | 6 | (1 | ) | |||||||||||||
| (Benefit) provision for income taxes | 5 | 5 | 16 | 15 | 21 | ||||||||||||||
| Stock-based compensation expense | 33 | 29 | 106 | 90 | 116 | ||||||||||||||
| Adjusted EBITDA(b)(c) | $ | 883 | $ | 853 | $ | 2,527 | $ | 2,483 | $ | 3,299 | |||||||||
Reconciliation of Current Outlook for Adjusted EBITDA:
| Full Year 2020 | Full Year 2021 | ||||||||||||
| (in millions) | Outlook | Outlook | |||||||||||
| Net income (loss) | to | to | |||||||||||
| Adjustments to increase (decrease) net income (loss): | |||||||||||||
| Asset write-down charges | to | to | |||||||||||
| Acquisition and integration costs | to | to | |||||||||||
| Depreciation, amortization and accretion | to | to | |||||||||||
| Amortization of prepaid lease purchase price adjustments | to | to | |||||||||||
| Interest expense and amortization of deferred financing costs(a) | to | to | |||||||||||
| (Gains) losses on retirement of long-term obligations | to | to | |||||||||||
| Interest income | to | to | |||||||||||
| Other (income) expense | to | to | |||||||||||
| (Benefit) provision for income taxes | to | to | |||||||||||
| Stock-based compensation expense | to | to | |||||||||||
| Adjusted EBITDA(b)(c) | $3,409 | to | $3,429 | $3,584 | to | $3,629 | |||||||
(a) See reconciliation of "components of current outlook for interest expense and amortization of deferred financing costs" for a discussion of non-cash interest expense.
(b) See "Non-GAAP Financial Measures, Segment Measures and Other Calculations" for a discussion of our definition of Adjusted EBITDA.
(c) The above reconciliation excludes line items included in our definition which are not applicable for the periods shown.
(d) See our Annual Report on Form 10-K for the year ended
Reconciliation of Historical FFO and AFFO:
| For the Three Months Ended | For the Nine Months Ended | For the Twelve Months Ended |
|||||||||||||||||
2020 |
2019 |
2020 |
2019 |
2019 |
|||||||||||||||
| (in millions, except per share amounts) | (As Restated)(f) | (As Restated)(f) | |||||||||||||||||
| Net income (loss) | $ | 163 | $ | 242 | $ | 548 | $ | 652 | $ | 860 | |||||||||
| Real estate related depreciation, amortization and accretion | 393 | 374 | 1,167 | 1,133 | 1,517 | ||||||||||||||
| Asset write-down charges | 3 | 2 | 10 | 13 | 19 | ||||||||||||||
| Dividends/distributions on preferred stock | (28 | ) | (28 | ) | (85 | ) | (85 | ) | (113 | ) | |||||||||
| FFO(a)(b)(c)(d) | $ | 531 | $ | 593 | $ | 1,640 | $ | 1,714 | $ | 2,284 | |||||||||
| Weighted-average common shares outstanding—diluted(e) | 429 | 418 | 422 | 418 | 418 | ||||||||||||||
| FFO per share(a)(b)(c)(d)(e) | $ | 1.24 | $ | 1.42 | $ | 3.89 | $ | 4.11 | $ | 5.47 | |||||||||
| FFO (from above) | $ | 531 | $ | 593 | $ | 1,640 | $ | 1,714 | $ | 2,284 | |||||||||
| Adjustments to increase (decrease) FFO: | |||||||||||||||||||
| Straight-lined revenue | (4 | ) | (22 | ) | (27 | ) | (62 | ) | (80 | ) | |||||||||
| Straight-lined expense | 21 | 24 | 61 | 70 | 93 | ||||||||||||||
| Stock-based compensation expense | 33 | 29 | 106 | 90 | 116 | ||||||||||||||
| Non-cash portion of tax provision | (7 | ) | 1 | 3 | 2 | 5 | |||||||||||||
| Non-real estate related depreciation, amortization and accretion | 13 | 14 | 40 | 42 | 55 | ||||||||||||||
| Amortization of non-cash interest expense | 1 | — | 4 | 1 | 1 | ||||||||||||||
| Other (income) expense | 3 | 5 | 3 | 6 | (1 | ) | |||||||||||||
| (Gains) losses on retirement of long-term obligations | 95 | — | 95 | 2 | 2 | ||||||||||||||
| Acquisition and integration costs | 2 | 4 | 9 | 10 | 13 | ||||||||||||||
| Sustaining capital expenditures | (20 | ) | (29 | ) | (64 | ) | (80 | ) | (117 | ) | |||||||||
| AFFO(a)(b)(c)(d) | $ | 668 | $ | 617 | $ | 1,870 | $ | 1,794 | $ | 2,371 | |||||||||
| Weighted-average common shares outstanding—diluted(e) | 429 | 418 | 422 | 418 | 418 | ||||||||||||||
| AFFO per share(a)(b)(c)(d)(e) | $ | 1.56 | $ | 1.47 | $ | 4.43 | $ | 4.29 | $ | 5.68 | |||||||||
(a) See "Non-GAAP Financial Measures, Segment Measures and Other Calculations" for a discussion of our definitions of FFO, including per share amounts, and AFFO, including per share amounts.
(b) FFO and AFFO are reduced by cash paid for preferred stock dividends during the period in which they are paid.
(c) Attributable to CCIC common stockholders.
(d) The above reconciliation excludes line items included in our definition which are not applicable for the periods shown.
(e) For all periods prior to those ended
(f) See our Annual Report on Form 10-K for the year ended
Reconciliation of Current Outlook for FFO and AFFO:
| Full Year 2020 | Full Year 2021 | |||||||||||||||||
| (in millions except per share amounts) | Outlook | Outlook | ||||||||||||||||
| Net income (loss) | to | $839 | to | |||||||||||||||
| Real estate related depreciation, amortization and accretion | to | to | ||||||||||||||||
| Asset write-down charges | to | $20 | to | $25 | ||||||||||||||
| Dividends/distributions on preferred stock | to | to | $0 | |||||||||||||||
| FFO(a)(b)(c)(d) | $2,300 |
to | $2,320 | $2,603 |
to | $2,648 | ||||||||||||
| Weighted-average common shares outstanding—diluted(e) | 425 | 434 | ||||||||||||||||
| FFO per share(a)(b)(c)(d)(e) | $5.41 |
to | $5.46 | $6.00 |
to | $6.10 | ||||||||||||
| FFO (from above) | to | to | ||||||||||||||||
| Adjustments to increase (decrease) FFO: | ||||||||||||||||||
| Straight-lined revenue | to | to | $58 | |||||||||||||||
| Straight-lined expense | to | $86 | to | $78 | ||||||||||||||
| Stock-based compensation expense | to | $138 | to | $149 | ||||||||||||||
| Non-cash portion of tax provision | to | $7 | to | $8 | ||||||||||||||
| Non-real estate related depreciation, amortization and accretion | to | $58 | to | $61 | ||||||||||||||
| Amortization of non-cash interest expense | to | $11 | to | $14 | ||||||||||||||
| Other (income) expense | to | $4 | to | $1 | ||||||||||||||
| (Gains) losses on retirement of long-term obligations | to | $95 | to | $100 | ||||||||||||||
| Acquisition and integration costs | to | $17 | to | $8 | ||||||||||||||
| Sustaining capital expenditures | to | to | ||||||||||||||||
| AFFO(a)(b)(c)(d) | $2,577 |
to | $2,597 | $2,883 |
to | $2,928 | ||||||||||||
| Weighted-average common shares outstanding—diluted(e) | 425 | 434 | ||||||||||||||||
| AFFO per share(a)(b)(c)(d)(e) | $6.07 |
to | $6.11 | to | $6.74 | |||||||||||||
(a) See "Non-GAAP Financial Measures, Segment Measures and Other Calculations" for a discussion of our definitions of FFO, including per share amounts, and AFFO, including per share amounts.
(b) FFO and AFFO are reduced by cash paid for preferred stock dividends during the period in which they are paid.
(c) Attributable to CCIC common stockholders.
(d) The above reconciliation excludes line items included in our definition which are not applicable for the periods shown.
(e) The assumption for diluted weighted-average common shares outstanding for full year 2020 Outlook is based on the diluted common shares outstanding as of
For Comparative Purposes - Reconciliation of Previous Outlook for Adjusted EBITDA:
| Previously Issued | |||||||||
| Full Year 2020 | |||||||||
| (in millions) | Outlook | ||||||||
| Net income (loss) | to | $983 | |||||||
| Adjustments to increase (decrease) net income (loss): | |||||||||
| Asset write-down charges | to | $30 | |||||||
| Acquisition and integration costs | to | $17 | |||||||
| Depreciation, amortization and accretion | to | ||||||||
| Amortization of prepaid lease purchase price adjustments | to | $20 | |||||||
| Interest expense and amortization of deferred financing costs | to | $736 | |||||||
| (Gains) losses on retirement of long-term obligations | to | $95 | |||||||
| Interest income | to | ||||||||
| Other (income) expense | to | $1 | |||||||
| (Benefit) provision for income taxes | to | $24 | |||||||
| Stock-based compensation expense | to | $130 | |||||||
| Adjusted EBITDA(a)(b) | $3,479 |
to | $3,524 | ||||||
(a) See "Non-GAAP Financial Measures, Segment Measures and Other Calculations" for a discussion of our definition of Adjusted EBITDA.
(b) The above reconciliation excludes line items included in our definition which are not applicable for the periods shown.
For Comparative Purposes - Reconciliation of Previous Outlook for FFO and AFFO:
| Previously Issued | |||||||||
| Full Year 2020 | |||||||||
| (in millions, except per share amounts) | Outlook | ||||||||
| Net income (loss) | to | $983 | |||||||
| Real estate related depreciation, amortization and accretion | to | ||||||||
| Asset write-down charges | to | $30 | |||||||
| Dividends/distributions on preferred stock | to | ||||||||
| FFO(a)(b)(c)(d) | $2,354 |
to | $2,399 | ||||||
| Weighted-average common shares outstanding—diluted(e) | 424 | ||||||||
| FFO per share(a)(b)(c)(d)(e) | $5.55 |
to | $5.65 | ||||||
| FFO (from above) | to | ||||||||
| Adjustments to increase (decrease) FFO: | |||||||||
| Straight-lined revenue | to | ||||||||
| Straight-lined expense | to | $90 | |||||||
| Stock-based compensation expense | to | $130 | |||||||
| Non-cash portion of tax provision | to | $9 | |||||||
| Non-real estate related depreciation, amortization and accretion | to | $64 | |||||||
| Amortization of non-cash interest expense | to | $6 | |||||||
| Other (income) expense | to | $1 | |||||||
| (Gains) losses on retirement of long-term obligations | to | $95 | |||||||
| Acquisition and integration costs | to | $17 | |||||||
| Sustaining capital expenditures | to | ||||||||
| AFFO(a)(b)(c)(d) | $2,572 |
to | $2,617 | ||||||
| Weighted-average common shares outstanding—diluted(e) | 424 | ||||||||
| AFFO per share(a)(b)(c)(d)(e) | $6.06 |
to | $6.17 | ||||||
(a) See "Non-GAAP Financial Measures, Segment Measures and Other Calculations" for a discussion of our definitions of FFO, including per share amounts, and AFFO, including per share amounts.
(b) FFO and AFFO are reduced by cash paid for preferred stock dividends during the period in which they are paid.
(c) Attributable to CCIC common stockholders.
(d) The above reconciliation excludes line items included in our definition which are not applicable for the periods shown.
(e) The assumption for diluted weighted-average common shares outstanding for full year 2020 Outlook is based on the diluted common shares outstanding as of
The components of changes in site rental revenues for the quarters ended
| Three Months Ended |
|||||||||
| 2020 | 2019 | ||||||||
| (dollars in millions) | (As Restated)(g) | ||||||||
| Components of changes in site rental revenues(a): | |||||||||
| Prior year site rental revenues exclusive of straight-lined revenues associated with fixed escalators(b)(c) | $ | 1,265 | $ | 1,188 | |||||
| New leasing activity(b)(c) | 93 | 99 | |||||||
| Escalators | 23 | 22 | |||||||
| Non-renewals | (46 | ) | (44 | ) | |||||
| Organic Contribution to Site Rental Revenues(d) | 70 | 77 | |||||||
| Impact from straight-lined revenues associated with fixed escalators | 4 | 22 | |||||||
| Acquisitions(e) | — | — | |||||||
| Other | — | — | |||||||
| Total GAAP site rental revenues | $ | 1,339 | $ | 1,287 | |||||
| Year-over-year changes in revenue: | |||||||||
| Reported GAAP site rental revenues | 4.0 | % | |||||||
| Organic Contribution to Site Rental Revenues(d)(f) | 5.5 | % | |||||||
The components of the changes in site rental revenues for the years ending
| (dollars in millions) | Previously Issued Full Year 2020 Outlook |
Current Full Year 2020 Outlook |
Current Full Year 2021 Outlook(j) |
||||||||
| Components of changes in site rental revenues(a): | |||||||||||
| Prior year site rental revenues exclusive of straight-lined revenues associated with fixed escalators(b)(c) | |||||||||||
| New leasing activity(b)(c) | 395-425 | 375-385 | 375-405 | ||||||||
| Escalators | 90-100 | 90-100 | 90-100 | ||||||||
| Non-renewals | (195)-(175) | (185)-(175) | (180)-(160) | ||||||||
| Organic Contribution to Site Rental Revenues(d) | 295-335 | 285-295 | 295-335 | ||||||||
| Impact from full year straight-lined revenues associated with fixed escalators | 33-53 | 17-27 | (38)-(58) | ||||||||
| Acquisitions(e) | — | <5 | <5 | ||||||||
| Other | — | — | — | ||||||||
| Total GAAP site rental revenues | |||||||||||
| Year-over-year changes in revenue: | |||||||||||
| Reported GAAP site rental revenues(h) | 5.1% | 4.4% | 4.5% | ||||||||
| Organic Contribution to Site Rental Revenues(d)(h)(i) | 6.3% | 5.8% | 5.9% | ||||||||
(a) Additional information regarding
(b) Includes revenues from amortization of prepaid rent in accordance with GAAP.
(c) Includes revenues from the construction of new small cell nodes, exclusive of straight-lined revenues related to fixed escalators.
(d) See "Non-GAAP Financial Measures, Segment Measures and Other Calculations" herein.
(e) Represents the contribution from recent acquisitions. The financial impact of recent acquisitions is excluded from Organic Contribution to Site Rental Revenues until the one-year anniversary of the acquisition.
(f) Calculated as the percentage change from prior year site rental revenues, exclusive of straight-lined revenues associated with fixed escalations, compared to Organic Contribution to Site Rental Revenues for the current period.
(g) See our Annual Report on Form 10-K for the year ended
(h) Calculated based on midpoint of respective full year Outlook.
(i) Calculated as the percentage change from prior year site rental revenues, exclusive of straight-lined revenues associated with fixed escalations, compared to Organic Contribution to Site Rental Revenues for the current period.
(j) Prior year site rental revenues exclusive of straight-lined revenues associated with fixed escalators is calculated based on midpoint of current full year 2020 Outlook.
Components of Historical Interest Expense and Amortization of Deferred Financing Costs:
| For the Three Months Ended | |||||||||||||||
| (in millions) | 2020 |
2019 |
|||||||||||||
| Interest expense on debt obligations | $ | 167 | $ | 173 | |||||||||||
| Amortization of deferred financing costs and adjustments on long-term debt, net | 6 | 5 | |||||||||||||
| Capitalized interest | (5 | ) | (5 | ) | |||||||||||
| Interest expense and amortization of deferred financing costs | $ | 168 | $ | 173 | |||||||||||
Components of Current Outlook for Interest Expense and Amortization of Deferred Financing Costs:
| Full Year 2020 | Full Year 2021 | ||||||||||||||||||
| (in millions) | Outlook | Outlook | |||||||||||||||||
| Interest expense on debt obligations | to | $688 | to | $688 | |||||||||||||||
| Amortization of deferred financing costs and adjustments on long-term debt, net | to | $26 | to | $26 | |||||||||||||||
| Capitalized interest | to | to | |||||||||||||||||
| Interest expense and amortization of deferred financing costs | $683 |
to | $693 | $663 |
to | $708 | |||||||||||||
Debt balances and maturity dates as of
| (in millions) | Face Value | Final Maturity | ||
| Cash, cash equivalents and restricted cash | $ | 421 | ||
| 3.849% Secured Notes | 1,000 | |||
| Secured Notes, Series 2009-1, Class A-2(a) | 62 | |||
| Tower Revenue Notes, Series 2015-1(b) | 300 | |||
| Tower Revenue Notes, Series 2018-1(b) | 250 | |||
| Tower Revenue Notes, Series 2015-2(b) | 700 | |||
| Tower Revenue Notes, Series 2018-2(b) | 750 | |||
| Finance leases and other obligations | 228 | Various | ||
| Total secured debt | $ | 3,290 | ||
| 2016 Revolver | 520 | |||
| 2016 Term Loan A | 2,268 | |||
| Commercial Paper Notes(c) | 75 | |||
| 5.250% Senior Notes | 1,650 | |||
| 3.150% Senior Notes | 750 | |||
| 3.200% Senior Notes | 750 | |||
| 1.350% Senior Notes | 500 | |||
| 4.450% Senior Notes | 900 | |||
| 3.700% Senior Notes | 750 | |||
| 4.000% Senior Notes | 500 | |||
| 3.650% Senior Notes | 1,000 | |||
| 3.800% Senior Notes | 1,000 | |||
| 4.300% Senior Notes | 600 | |||
| 3.100% Senior Notes | 550 | |||
| 3.300% Senior Notes | 750 | |||
| 2.250% Senior Notes | 1,100 | |||
| 4.750% Senior Notes | 350 | |||
| 5.200% Senior Notes | 400 | |||
| 4.000% Senior Notes | 350 | |||
| 4.150% Senior Notes | 500 | |||
| 3.250% Senior Notes | 900 | |||
| Total unsecured debt | $ | 16,163 | ||
| Total net debt | $ | 19,032 | ||
Net Debt to Last Quarter Annualized Adjusted EBITDA is computed as follows:
| (dollars in millions) | For the Three Months Ended September 30, 2020 |
||||
| Total face value of debt | $ | 19,453 | |||
| Less: Ending cash, cash equivalents and restricted cash | 421 | ||||
| Total Net Debt | $ | 19,032 | |||
| Adjusted EBITDA for the three months ended |
$ | 883 | |||
| Last quarter annualized Adjusted EBITDA | 3,532 | ||||
| Net Debt to Last Quarter Annualized Adjusted EBITDA | 5.4 | x | |||
(a) The Senior Secured Notes, 2009-1, Class A-2 principal amortizes over a period ending in
(b) The Senior Secured Tower Revenue Notes, Series 2015-1 and 2015-2 have anticipated repayment dates in 2022 and 2025, respectively. The Senior Secured Tower Revenue Notes, Series 2018-1 and 2018-2 have anticipated repayment dates in 2023 and 2028, respectively.
(c) The maturities of the Commercial Paper Notes, when outstanding, may vary but may not exceed 397 days from the date of issue.
Components of Capital Expenditures:
| For the Three Months Ended | |||||||||||||||||||||||||
| (in millions) | |||||||||||||||||||||||||
| Towers | Fiber | Other | Total | Towers | Fiber | Other | Total | ||||||||||||||||||
| Discretionary: | |||||||||||||||||||||||||
| Purchases of land interests | $ | 12 | $ | — | $ | — | $ | 12 | $ | 18 | $ | — | $ | — | $ | 18 | |||||||||
| Communications infrastructure improvements and other capital projects | 61 | 274 | 10 | 345 | 119 | 371 | — | 490 | |||||||||||||||||
| Sustaining | 3 | 13 | 4 | 20 | 8 | 11 | 10 | 29 | |||||||||||||||||
| Integration | — | — | — | — | — | — | 2 | 2 | |||||||||||||||||
| Total | $ | 76 | $ | 287 | $ | 14 | $ | 377 | $ | 145 | $ | 382 | $ | 12 | $ | 539 | |||||||||
Note: See "Non-GAAP Financial Measures, Segment Measures and Other Calculations" for further discussion of our components of capital expenditures.
Cautionary Language Regarding Forward-Looking Statements
This news release contains forward-looking statements and information that are based on our management's current expectations as of the date of this news release. Statements that are not historical facts are hereby identified as forward-looking statements. In addition, words such as "estimate," "see," "anticipate," "project," "plan," "intend," "believe," "expect," "likely," "predicted," "positioned," "continue," "target," and any variations of these words and similar expressions are intended to identify forward-looking statements. Such statements include our full year 2020 and 2021 Outlook and plans, projections, and estimates regarding (1) potential benefits, growth, returns, capabilities, opportunities and shareholder value which may be derived from our business, assets, investments, acquisitions and dividends, (2) our business, strategy, strategic position, business model and capabilities and the strength thereof, (3) industry fundamentals and driving factors for improvements in such fundamentals, (4) our customers' investment, including investment cycles and the timing thereof, in network improvements (including 5G), the trends driving such improvements and opportunities and demand for our assets created thereby, (5) our long-and short-term prospects and the trends, events and industry activities impacting our business, (6) opportunities we see to deliver value to our shareholders, (7) our dividends (including timing of payment thereof) and our dividend (including on a per share basis) growth rate, including its driving factors, and targets, (8) expected completion of fiber expansion projects, (9) small cell backlog, (10) debt maturities, (11) strategic position of our portfolio of assets, (12) cash flows, including growth thereof, (13) leasing activity and the timing thereof, (14) tenant non-renewals, including the impact and timing thereof, (15) capital expenditures, including sustaining and discretionary capital expenditures, the timing thereof and any efficiencies that may result therefrom, and the discretionary capital budget and the funding thereof, (16) straight-line adjustments, (17) revenues and growth thereof and benefits derived therefrom, (18) net income (loss) (including on a per share basis), (19) Adjusted EBITDA, including components thereof and growth thereof, (20) expenses, including interest expense and amortization of deferred financing costs, (21) FFO (including on a per share basis) and growth thereof, (22) AFFO (including on a per share basis) and its components and growth thereof and corresponding driving factors, (23) Organic Contribution to Site Rental Revenues and its components, including growth thereof and contributions therefrom, (24) our weighted-average common shares outstanding (including on a diluted basis) and growth thereof, (25) services contribution, (26) pre-paid rent, (27) appointment of directors, including the effective date thereof, and (28) the utility of certain financial measures, including non-GAAP financial measures. Such forward-looking statements are subject to certain risks, uncertainties and assumptions, including prevailing market conditions and the following:
- Our business depends on the demand for our communications infrastructure, driven primarily by demand for data, and we may be adversely affected by any slowdown in such demand. Additionally, a reduction in the amount or change in the mix of network investment by our tenants may materially and adversely affect our business (including reducing demand for our communications infrastructure or services).
- A substantial portion of our revenues is derived from a small number of tenants, and the loss, consolidation or financial instability of any of such tenants may materially decrease revenues or reduce demand for our communications infrastructure and services.
- The expansion or development of our business, including through acquisitions, increased product offerings or other strategic growth opportunities, may cause disruptions in our business, which may have an adverse effect on our business, operations or financial results.
- Our Fiber segment has expanded rapidly, and the Fiber business model contains certain differences from our Towers business model, resulting in different operational risks. If we do not successfully operate our Fiber business model or identify or manage the related operational risks, such operations may produce results that are lower than anticipated.
- Failure to timely and efficiently execute on our construction projects could adversely affect our business.
- Our substantial level of indebtedness could adversely affect our ability to react to changes in our business, and the terms of our debt instruments limit our ability to take a number of actions that our management might otherwise believe to be in our best interests. In addition, if we fail to comply with our covenants, our debt could be accelerated.
- We have a substantial amount of indebtedness. In the event we do not repay or refinance such indebtedness, we could face substantial liquidity issues and might be required to issue equity securities or securities convertible into equity securities, or sell some of our assets to meet our debt payment obligations.
- Sales or issuances of a substantial number of shares of our common stock or securities convertible into shares of our common stock may adversely affect the market price of our common stock.
- As a result of competition in our industry, we may find it more difficult to negotiate favorable rates on our new or renewing tenant contracts.
- New technologies may reduce demand for our communications infrastructure or negatively impact our revenues.
- If we fail to retain rights to our communications infrastructure, including the land interests under our towers and the right-of-way and other agreements related to our small cells and fiber, our business may be adversely affected.
- Our services business has historically experienced significant volatility in demand, which reduces the predictability of our results.
- The restatement of our previously issued financial statements, the errors that resulted in such restatement, the material weakness that was identified in our internal control over financial reporting and the determination that our internal control over financial reporting and disclosure controls and procedures were not effective, could result in loss of investor confidence, shareholder litigation or governmental proceedings or investigations, any of which could cause the market value of our common stock or debt securities to decline or impact our ability to access the capital markets.
- New wireless technologies may not deploy or be adopted by tenants as rapidly or in the manner projected.
- If we fail to comply with laws or regulations which regulate our business and which may change at any time, we may be fined or even lose our right to conduct some of our business.
- If radio frequency emissions from wireless handsets or equipment on our communications infrastructure are demonstrated to cause negative health effects, potential future claims could adversely affect our operations, costs or revenues.
- Certain provisions of our restated certificate of incorporation, amended and restated by-laws and operative agreements, and domestic and international competition laws may make it more difficult for a third party to acquire control of us or for us to acquire control of a third party, even if such a change in control would be beneficial to our stockholders.
- We may be vulnerable to security breaches or other unforeseen events that could adversely affect our operations, business, and reputation.
- Future dividend payments to our stockholders will reduce the availability of our cash on hand available to fund future discretionary investments, and may result in a need to incur indebtedness or issue equity securities to fund growth opportunities. In such event, the then current economic, credit market or equity market conditions will impact the availability or cost of such financing, which may hinder our ability to grow our per share results of operations.
- Remaining qualified to be taxed as a REIT involves highly technical and complex provisions of the
U.S. Internal Revenue Code. Failure to remain qualified as a REIT would result in our inability to deduct dividends to stockholders when computing our taxable income, which would reduce our available cash. - Complying with REIT requirements, including the 90% distribution requirement, may limit our flexibility or cause us to forgo otherwise attractive opportunities, including certain discretionary investments and potential financing alternatives.
- REIT related ownership limitations and transfer restrictions may prevent or restrict certain transfers of our capital stock.
- The impact of COVID-19 and related risks could materially affect our financial position, results of operations and cash flows.
Should one or more of these or other risks or uncertainties materialize, or should underlying assumptions prove incorrect, actual results may vary materially from those expected. More information about potential risk factors which could affect our results is included in our filings with the
As used in this release, the term "including," and any variation thereof, means "including without limitation."
CONDENSED CONSOLIDATED BALANCE SHEET (UNAUDITED) (Amounts in millions, except par values) |
2020 |
2019 |
||||||
| ASSETS | |||||||
| Current assets: | |||||||
| Cash and cash equivalents | $ | 242 | $ | 196 | |||
| Restricted cash | 174 | 137 | |||||
| Receivables, net | 455 | 596 | |||||
| Prepaid expenses | 112 | 107 | |||||
| Other current assets | 201 | 168 | |||||
| Total current assets | 1,184 | 1,204 | |||||
| Deferred site rental receivables | 1,420 | 1,424 | |||||
| Property and equipment, net | 15,092 | 14,666 | |||||
| Operating lease right-of-use assets | 6,357 | 6,133 | |||||
| 10,078 | 10,078 | ||||||
| Other intangible assets, net | 4,535 | 4,836 | |||||
| Other assets, net | 120 | 116 | |||||
| Total assets | $ | 38,786 | $ | 38,457 | |||
| LIABILITIES AND EQUITY | |||||||
| Current liabilities: | |||||||
| Accounts payable | $ | 264 | $ | 334 | |||
| Accrued interest | 122 | 169 | |||||
| Deferred revenues | 787 | 657 | |||||
| Other accrued liabilities | 322 | 361 | |||||
| Current maturities of debt and other obligations | 114 | 100 | |||||
| Current portion of operating lease liabilities | 316 | 299 | |||||
| Total current liabilities | 1,925 | 1,920 | |||||
| Debt and other long-term obligations | 19,190 | 18,021 | |||||
| Operating lease liabilities | 5,713 | 5,511 | |||||
| Other long-term liabilities | 2,456 | 2,516 | |||||
| Total liabilities | 29,284 | 27,968 | |||||
| Commitments and contingencies | |||||||
| CCIC stockholders' equity: | |||||||
| Common stock, |
4 | 4 | |||||
| 6.875% Mandatory Convertible Preferred Stock, Series A, |
— | — | |||||
| Additional paid-in capital | 17,904 | 17,855 | |||||
| Accumulated other comprehensive income (loss) | (4 | ) | (5 | ) | |||
| Dividends/distributions in excess of earnings | (8,402 | ) | (7,365 | ) | |||
| Total equity | 9,502 | 10,489 | |||||
| Total liabilities and equity | $ | 38,786 | $ | 38,457 | |||
CONDENSED CONSOLIDATED STATEMENT OF OPERATIONS (UNAUDITED) (Amounts in millions, except per share amounts) |
| Three Months Ended |
Nine Months Ended |
||||||||||||||
| 2020 | 2019 | 2020 | 2019 | ||||||||||||
| (As Restated)(a) | (As Restated)(a) | ||||||||||||||
| Net revenues: | |||||||||||||||
| Site rental | $ | 1,339 | $ | 1,287 | $ | 3,968 | $ | 3,793 | |||||||
| Services and other | 147 | 195 | 379 | 544 | |||||||||||
| Net revenues | 1,486 | 1,482 | 4,347 | 4,337 | |||||||||||
| Operating expenses: | |||||||||||||||
| Costs of operations(b): | |||||||||||||||
| Site rental | 370 | 369 | 1,123 | 1,095 | |||||||||||
| Services and other | 117 | 146 | 324 | 407 | |||||||||||
| Selling, general and administrative | 154 | 150 | 493 | 457 | |||||||||||
| Asset write-down charges | 3 | 2 | 10 | 13 | |||||||||||
| Acquisition and integration costs | 2 | 4 | 9 | 10 | |||||||||||
| Depreciation, amortization and accretion | 406 | 388 | 1,207 | 1,175 | |||||||||||
| Total operating expenses | 1,052 | 1,059 | 3,166 | 3,157 | |||||||||||
| Operating income (loss) | 434 | 423 | 1,181 | 1,180 | |||||||||||
| Interest expense and amortization of deferred financing costs | (168 | ) | (173 | ) | (521 | ) | (510 | ) | |||||||
| Gains (losses) on retirement of long-term obligations | (95 | ) | — | (95 | ) | (2 | ) | ||||||||
| Interest income | — | 2 | 2 | 5 | |||||||||||
| Other income (expense) | (3 | ) | (5 | ) | (3 | ) | (6 | ) | |||||||
| Income (loss) before income taxes | 168 | 247 | 564 | 667 | |||||||||||
| Benefit (provision) for income taxes | (5 | ) | (5 | ) | (16 | ) | (15 | ) | |||||||
| Net income (loss) | 163 | 242 | 548 | 652 | |||||||||||
| Dividends/distributions on preferred stock | — | (28 | ) | (57 | ) | (85 | ) | ||||||||
| Net income (loss) attributable to CCIC common stockholders | $ | 163 | $ | 214 | $ | 491 | $ | 567 | |||||||
| Net income (loss) attributable to CCIC common stockholders, per common share: | |||||||||||||||
| Net income (loss) attributable to CCIC common stockholders, basic | $ | 0.38 | $ | 0.51 | $ | 1.17 | $ | 1.36 | |||||||
| Net income (loss) attributable to CCIC common stockholders, diluted | $ | 0.38 | $ | 0.51 | $ | 1.17 | $ | 1.36 | |||||||
| Weighted-average common shares outstanding: | |||||||||||||||
| Basic | 427 | 416 | 420 | 416 | |||||||||||
| Diluted | 429 | 418 | 422 | 418 | |||||||||||
(a) See our Annual Report on Form 10-K for the year ended
(b) Exclusive of depreciation, amortization and accretion shown separately.
CONDENSED CONSOLIDATED STATEMENT OF CASH FLOWS (UNAUDITED) (In millions of dollars) |
| Nine Months Ended |
|||||||
| 2020 | 2019 | ||||||
| (As Restated)(a) | |||||||
| Cash flows from operating activities: | |||||||
| Net income (loss) | $ | 548 | $ | 652 | |||
| Adjustments to reconcile net income (loss) to net cash provided by (used for) operating activities: | |||||||
| Depreciation, amortization and accretion | 1,207 | 1,175 | |||||
| (Gains) losses on retirement of long-term obligations | 95 | 2 | |||||
| Amortization of deferred financing costs and other non-cash interest, net | 4 | 1 | |||||
| Stock-based compensation expense | 108 | 91 | |||||
| Asset write-down charges | 10 | 13 | |||||
| Deferred income tax (benefit) provision | 2 | 2 | |||||
| Other non-cash adjustments, net | 4 | 4 | |||||
| Changes in assets and liabilities, excluding the effects of acquisitions: | |||||||
| Increase (decrease) in liabilities | (29 | ) | 178 | ||||
| Decrease (increase) in assets | 121 | (228 | ) | ||||
| Net cash provided by (used for) operating activities | 2,070 | 1,890 | |||||
| Cash flows from investing activities: | |||||||
| Capital expenditures | (1,238 | ) | (1,537 | ) | |||
| Payments for acquisitions, net of cash acquired | (86 | ) | (15 | ) | |||
| Other investing activities, net | (12 | ) | 3 | ||||
| Net cash provided by (used for) investing activities | (1,336 | ) | (1,549 | ) | |||
| Cash flows from financing activities: | |||||||
| Proceeds from issuance of long-term debt | 3,733 | 1,895 | |||||
| Principal payments on debt and other long-term obligations | (80 | ) | (59 | ) | |||
| Purchases and redemptions of long-term debt | (2,490 | ) | (12 | ) | |||
| Borrowings under revolving credit facility | 2,140 | 1,585 | |||||
| Payments under revolving credit facility | (2,145 | ) | (2,270 | ) | |||
| Net borrowings (repayments) under commercial paper program | (80 | ) | — | ||||
| Payments for financing costs | (38 | ) | (24 | ) | |||
| Purchases of common stock | (75 | ) | (44 | ) | |||
| Dividends/distributions paid on common stock | (1,531 | ) | (1,415 | ) | |||
| Dividends/distributions paid on preferred stock | (85 | ) | (85 | ) | |||
| Net cash provided by (used for) financing activities | (651 | ) | (429 | ) | |||
| Net increase (decrease) in cash, cash equivalents, and restricted cash | 83 | (88 | ) | ||||
| Effect of exchange rate changes on cash | — | — | |||||
| Cash, cash equivalents, and restricted cash at beginning of period | 338 | 413 | |||||
| Cash, cash equivalents, and restricted cash at end of period | $ | 421 | $ | 325 | |||
| Supplemental disclosure of cash flow information: | |||||||
| Interest paid | 564 | 547 | |||||
| Income taxes paid | 13 | 13 | |||||
(a) See our Annual Report on Form 10-K for the year ended
SEGMENT OPERATING RESULTS (UNAUDITED) (In millions of dollars) |
| SEGMENT OPERATING RESULTS | |||||||||||||||||||||||||||||||
| Three Months Ended |
Three Months Ended |
||||||||||||||||||||||||||||||
| (As Restated)(e) | |||||||||||||||||||||||||||||||
| Towers | Fiber | Other | Consolidated Total |
Towers | Fiber | Other | Consolidated Total |
||||||||||||||||||||||||
| Segment site rental revenues | $ | 877 | $ | 462 | $ | 1,339 | $ | 856 | $ | 431 | $ | 1,287 | |||||||||||||||||||
| Segment services and other revenues | 142 | 5 | 147 | 191 | 4 | 195 | |||||||||||||||||||||||||
| Segment revenues | 1,019 | 467 | 1,486 | 1,047 | 435 | 1,482 | |||||||||||||||||||||||||
| Segment site rental cost of operations | 216 | 145 | 361 | 218 | 141 | 359 | |||||||||||||||||||||||||
| Segment services and other cost of operations | 111 | 4 | 115 | 142 | 2 | 144 | |||||||||||||||||||||||||
| Segment cost of operations(a)(b) | 327 | 149 | 476 | 360 | 143 | 503 | |||||||||||||||||||||||||
| Segment site rental gross margin(c) | 661 | 317 | 978 | 638 | 290 | 928 | |||||||||||||||||||||||||
| Segment services and other gross margin(c) | 31 | 1 | 32 | 49 | 2 | 51 | |||||||||||||||||||||||||
| Segment selling, general and administrative expenses(b) | 22 | 42 | 64 | 23 | 49 | 72 | |||||||||||||||||||||||||
| Segment operating profit(c) | 670 | 276 | 946 | 664 | 243 | 907 | |||||||||||||||||||||||||
| Other selling, general and administrative expenses(b) | $ | 63 | 63 | $ | 56 | 56 | |||||||||||||||||||||||||
| Stock-based compensation expense | 33 | 33 | 29 | 29 | |||||||||||||||||||||||||||
| Depreciation, amortization and accretion | 406 | 406 | 388 | 388 | |||||||||||||||||||||||||||
| Interest expense and amortization of deferred financing costs | 168 | 168 | 173 | 173 | |||||||||||||||||||||||||||
| Other (income) expenses to reconcile to income (loss) before income taxes(d) | 108 | 108 | 14 | 14 | |||||||||||||||||||||||||||
| Income (loss) before income taxes | $ | 168 | $ | 247 | |||||||||||||||||||||||||||
| FIBER SEGMENT SITE RENTAL REVENUES SUMMARY | |||||||||||||||||||||||
| Three Months Ended |
|||||||||||||||||||||||
| 2020 | 2019 | ||||||||||||||||||||||
| Fiber Solutions | Small Cells | Total | Fiber Solutions | Small Cells | Total | ||||||||||||||||||
| Site rental revenues | $ | 323 | $ | 139 | $ | 462 | $ | 311 | $ | 120 | $ | 431 | |||||||||||
(a) Exclusive of depreciation, amortization and accretion shown separately.
(b) Segment cost of operations excludes (1) stock-based compensation expense of
(c) See "Non-GAAP Financial Measures, Segment Measures and Other Calculations" for a discussion of our definitions of segment site rental gross margin, segment services and other gross margin and segment operating profit.
(d) See condensed consolidated statement of operations for further information.
(e) See our Annual Report on Form 10-K for the year ended
| SEGMENT OPERATING RESULTS | |||||||||||||||||||||||||||||||
| Nine Months Ended |
Nine Months Ended |
||||||||||||||||||||||||||||||
| (As Restated)(e) | |||||||||||||||||||||||||||||||
| Towers | Fiber | Other | Consolidated Total |
Towers | Fiber | Other | Consolidated Total |
||||||||||||||||||||||||
| Segment site rental revenues | $ | 2,612 | $ | 1,356 | $ | 3,968 | $ | 2,526 | $ | 1,267 | $ | 3,793 | |||||||||||||||||||
| Segment services and other revenues | 367 | 12 | 379 | 533 | 11 | 544 | |||||||||||||||||||||||||
| Segment revenues | 2,979 | 1,368 | 4,347 | 3,059 | 1,278 | 4,337 | |||||||||||||||||||||||||
| Segment site rental cost of operations | 648 | 447 | 1,095 | 647 | 418 | 1,065 | |||||||||||||||||||||||||
| Segment services and other cost of operations | 311 | 8 | 319 | 395 | 6 | 401 | |||||||||||||||||||||||||
| Segment cost of operations(a)(b) | 959 | 455 | 1,414 | 1,042 | 424 | 1,466 | |||||||||||||||||||||||||
| Segment site rental gross margin(c) | 1,964 | 909 | 2,873 | 1,879 | 849 | 2,728 | |||||||||||||||||||||||||
| Segment services and other gross margin(c) | 56 | 4 | 60 | 138 | 5 | 143 | |||||||||||||||||||||||||
| Segment selling, general and administrative expenses(b) | 71 | 137 | 208 | 73 | 147 | 220 | |||||||||||||||||||||||||
| Segment operating profit(c) | 1,949 | 776 | 2,725 | 1,944 | 707 | 2,651 | |||||||||||||||||||||||||
| Other selling, general and administrative expenses(b) | $ | 198 | 198 | $ | 168 | 168 | |||||||||||||||||||||||||
| Stock-based compensation expense | 106 | 106 | 90 | 90 | |||||||||||||||||||||||||||
| Depreciation, amortization and accretion | 1,207 | 1,207 | 1,175 | 1,175 | |||||||||||||||||||||||||||
| Interest expense and amortization of deferred financing costs | 521 | 521 | 510 | 510 | |||||||||||||||||||||||||||
| Other (income) expenses to reconcile to income (loss) before income taxes(d) | 129 | 129 | 41 | 41 | |||||||||||||||||||||||||||
| Income (loss) before income taxes | $ | 564 | $ | 667 | |||||||||||||||||||||||||||
| FIBER SEGMENT SITE RENTAL REVENUES SUMMARY | |||||||||||||||||||||||
| Nine Months Ended |
|||||||||||||||||||||||
| 2020 | 2019 | ||||||||||||||||||||||
| Fiber Solutions | Small Cells | Total | Fiber Solutions | Small Cells | Total | ||||||||||||||||||
| Site rental revenues | $ | 950 | $ | 406 | $ | 1,356 | $ | 921 | $ | 346 | $ | 1,267 | |||||||||||
(a) Exclusive of depreciation, amortization and accretion shown separately.
(b) Segment cost of operations excludes (1) stock-based compensation expense of
(c) See "Non-GAAP Financial Measures, Segment Measures and Other Calculations" for a discussion of our definitions of segment site rental gross margin, segment services and other gross margin and segment operating profit.
(d) See condensed consolidated statement of operations for further information.
(e) See our Annual Report on Form 10-K for the year ended
| Contacts: | |
| 713-570-3050 |
![]()
Source: Crown Castle International Corporation